Mosaic
Mosaic logo

Mosaic

Redistricting via Recombination, with Simulated Annealing.

Mosaic running a redistricting plan, choropleth redrawing each iteration

Mosaic is a desktop tool for ReCom + simulated annealing redistricting. Load a shapefile, configure scoring, and watch each iteration redraw the map and update the metrics in real time.

Features

Live map

The choropleth redraws each iteration as ReCom merges and re-splits districts.

Weighted scoring

Compactness, county splits, population deviation, mean-median, efficiency gap, and more.

CSV export

Save final assignments, score histories, and per-district metrics for further analysis.

Screenshots

Georgia congressional districts rendered as a choropleth in Mosaic, with nine districts in distinct colors.
Mosaic can align districts with county boundaries to reduce splits.
Bar chart of Democratic vote share per district, sorted least to most Democratic, with a 50% reference line.
Tracking partisanship allows Mosaic to draw maps that are fair, competitive, or neither.
The Mosaic GUI mid-run: Virginia districts on the live map, score history charts, and metric-weight controls.
The Mosaic interface during a live run.

Get Mosaic

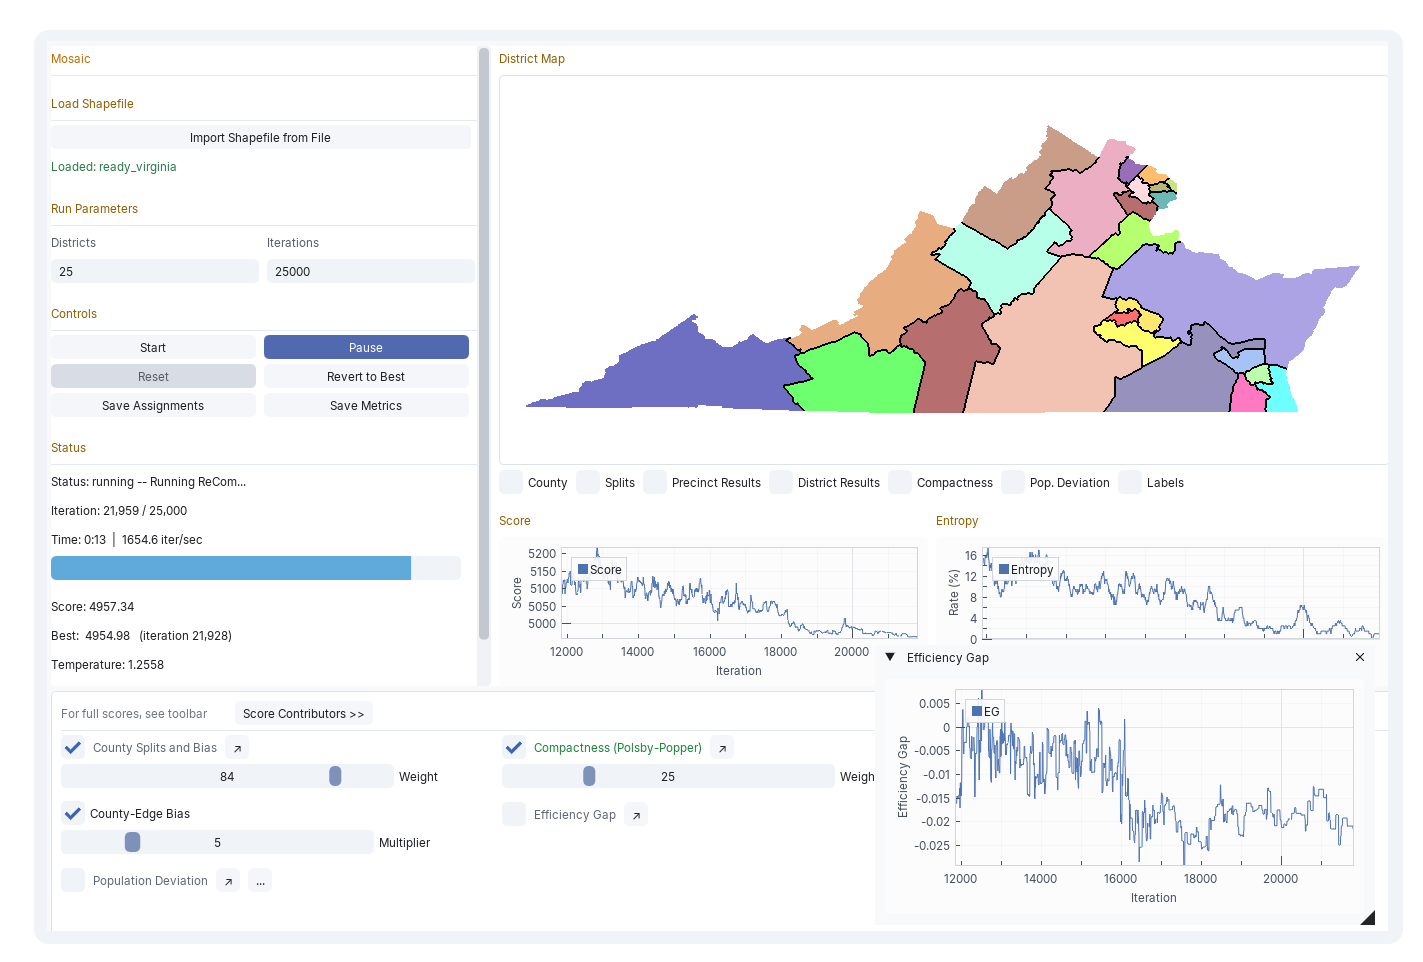
Five-minute install on Windows or Mac. No Python knowledge required — a launcher script handles dependencies the first time you run it.

Read the install guide →